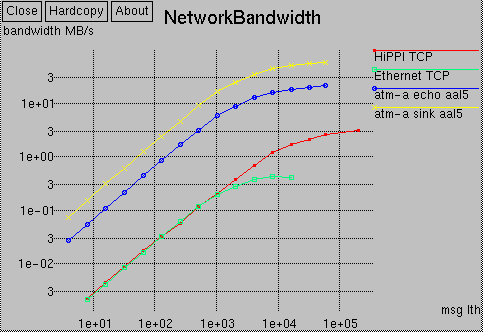

This figure plots ATM AAL5 echo and sink bandwidth between two Paragons (NIC-A) along with Ethernet and HiPPI bandwidth. The HiPPI and Ethernet bandwidth are measured with TCP/IP using ttcp and a window size of 250KB. Ttcp was run from a compute node on each Paragon.

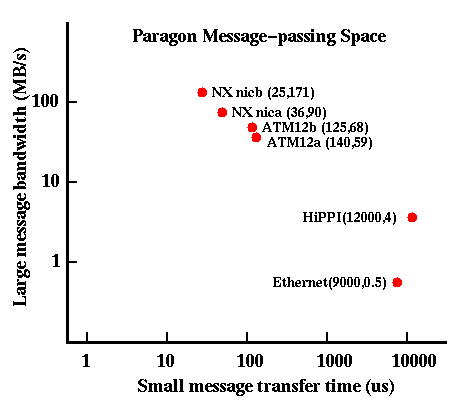
This figure plots the various message-passing options in a 2-D space. The horizontal axis is the one-way transfer time for a 0 or 8-byte message. The vertical axis is bandwidth as measured with a 1 MB message. The desirable area of the space is the upper left corner. Notice that the Paragon-to-Paragon Ethernet and HiPPI performance is particularly poor. The Ethernet and HiPPI performance are measured over TCP/IP. Typical workstation Ethernet/IP performance is 500us and 900 KB/s. Cross-country latency and OC3 speeds will shift the ATM performance to the right and down.