
| Tennessee Sinkholes |
| Waypoint | Sinkhole | County | Locale |
| BTS001 | Bull Sink 122' | Blount | GSMNP |
| BTS002 | Whiteoak Sink 199' | Blount | GSMNP |
| CAS001 | Bailey 120' | Campbell | |
| CTS001 | Sinking Cr 104' | Carter | |
| CTS002 | Siam Sink 102' | Carter | |
| CLS001 | Arthur 102' | Claiborne | |
| CLS002 | Atkins Sink 140' | Claiborne | |
| CLS003 | Big Sink 165' | Claiborne | |
| CLS004 | Duncan Hollow 136' | Claiborne | |
| CLS005 | Goin 100' | Claiborne | |
| CLS006 | Miracle Pond 114' | Claiborne | |
| COS001 | Good Hope 118' | Cocke | |
| CUS001 | Grassy Cove 140' | Cumberland | |
| CUS002 | Little Cove 130' | Cumberland | |
| FRS001 | The Big Sink 111' | Franklin | |
| FRS002 | Wolf Cove 242' | Franklin | |
| FRS003 | Round Cove 104' | Franklin | |
| GUS001 | Beersheba 105' | Grundy | |
| GUS002 | Dykes 156' | Grundy | |
| GUS003 | Sandstone 103' | Grundy | |
| HNS001 | Yount Town 109' | Hancock | |
| HNS002 | Snap 103' | Hancock | |
| MIS001 | Mitchell Sink 109' | Marion | |
| OVS001 | Cane Hollow 107' | Overton | |
| OVS002 | Gore 111' | Overton | |
| OVS003 | Hoss 133' | Overton | |
| OVS004 | Hunter 160' | Overton | |
| OVS005 | Staggs 141' | Overton | |
| OVS006 | Wilson Mtn 119' | Overton | |
| PUS001 | Davidson 123' | Putnam | |
| PUS002 | Icy Cove 206' | Putnam | |
| PUS003 | Round Cove 150' | Putnam | |
| PUS004 | Walkers Hollow 100' | Putnam | |
| VBS001 | Big Sink 123' | VanBuren | |
| VBS002 | Hills Sink 140' | VanBuren | |
| VBS003 | Millstone 102' | VanBuren | |
| VBS004 | Turkey Cot Cove 141' | VanBuren | |
| WAS001 | Big Sink 142' | Warren | |
| WAS002 | Brown Mtn 182' | Warren | |
| WHS001 | Big Sink 261' | White | |
| WHS002 | Hell Hole 122' | White | |
| WHS003 | Mill Hole 117' | White | |
| WHS004 | Pass Cove 118' | White |
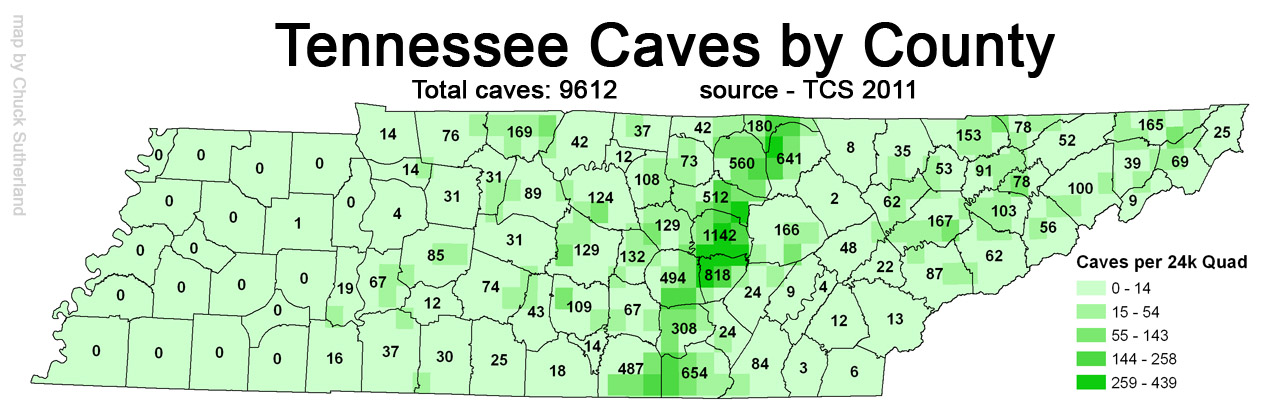
Approximately 25% of the earth's surface is karst landscape, and 20% of the US is made up of karst terrain. Tennessee sits atop a karst corridor so there are innumerable sinkholes in Tennessee, and the number is growing. The table above lists only those sinkholes with depths greater than 100'. Initial depths were estimated from USGS digital elevation data (10m DEM, see example or another). The first 34 were discovered by visual examination of online topo maps. Chuck Sutherland later (2013) provided a digital analysis (see below) from 10m DEM using Spatial Analyst in ArcMap that identified 9 more 100'+ sinkholes and provided depth, area, and volume. Big Sink in White County is the deepest (262.7'), but Grassy Cove, a National Natural Landmark, has the biggest area (5 square miles) and largest volume (see below for top 10 in area and volume). Additions and corrections welcome.
There are serveral impact craters in Tennessee, but they are not visually significant.

Visual analysis -- topo reconnaissance
In the 2001 Shofner study, geology students were assigned the task of scanning the state's topo maps (7.5' quadrangles) for sinkholes (hachured contours). A grid was provided for a quadrangle, and the students counted the number of sinkhole contour lines that crossed the grid lines. So rather than just a raw count of sinkholes, the metric accounted somewhat for depth and area. Here are density maps gray scale or color from the study. We were unable to locate the raw data counts from the study.
In 2013 using javascript and on-line topos (CalTopo.com), we clicked on TN sinkholes to record lat,lon. There are over 54,000 sinkholes visible on the 800 USGS TN topo quadrangles. The Talbott quadrangle has over 1,280 sinkholes, and many more uncounted beneath Cherokee Lake. (By comparison, the Bald Knob quadrangle has the highest number of caves at 345.) Counting sinkholes from the USGS topo maps or the equivalent digital DEM data reveals only the sinkholes that were visible with the photogrammetric techniques used to process the USGS aerial photos. This simple sinkhole count does not account for sinkhole volume (area*depth), so Grassy Cove counts as 1 just like one of the teeny spot sinkholes. Also topo contour interval (10', 20', or 40') can affect the number of sinkholes noted on USGS maps -- 10' contour maps typically showing more sinkholes. Most TN quads are 20' contours.
There are many more (5 times?) sinkholes than the 54,000 recorded by the USGS photogrammetric technigues. In hiking karstic areas, you will find many sinkholes that don't show on the USGS topo maps. Ongoing LiDAR aerial surveys should provide more detailed topographic data, 2013-16 surveys.

|

|
| Quadrangle | Sinkholes |
|---|---|
| Talbott | 1284 |
| Verona | 1124 |
| Sango | 920 |
| Springfield North | 907 |
| Livingston | 896 |
| Unionville | 829 |
| Vine | 819 |
| Sparta | 813 |
513 of the state's 803 7.5' quads have at least one sinkhole (64%). 85 of the state's 95 counties have at least one sinkhole (89%). If we refine the data by dividing each quad into a 3x3 grid, then about 30% of the state's 7,227 cells have at least one sinkhole. As an example of the sinkhole clustering, see the Anderson county sinkholes.
Chuck Sutherland located Tennessee sinkholes in the USGS 10m DEM digital elevation data (2013) using Spatial Analyst with ArcMap. The nominal accuracy of USGS topo elevation data is half the contour-interval. Most of Tennessee topos use 20' contour, so the digital analysis summarized here only considers sinkholes with a depth of at least 3m. The ArcMap analysis provides sinkhole location (boundary path), area, perimeter, depth, and volume.
The raw data located 21,365 sinkholes (or depressions) with a depth of at least 3m. It is necessary to review the raw data and remove false sinkholes ("fauxholes"). Outliers include man-made depressions (quarries, gravel pits, clay pits, strip-mine holding ponds, levees, road impoundments) and non-karst depressions such as stream-channel depressions and depressions in the sandy soils of west Tennessee. There were also digital anomalies at some quad boundaries, perhaps, reflecting older DEM data based on 7.5' quadrangles. At least 15.4% of the data were false sinkholes -- scrubbing is ongoing.
| County | Sinkholes | DEM 3m+ |
|---|---|---|
| Robertson | 3,602 | 861 |
| Montgomery | 3,025 | 900 |
| Rutherford | 2,988 | 572 |
| White | 2,970 | 1,070 |
| Jefferson | 2,364 | 773 |
 Similary, the underlying sinkholes per quad are roughly the same.
For all sinkholes visible on topo, the
Talbott quadrangle has the
highest count at 1,284, but for DEM sinkholes with a depth of at least 3m,
the Livingston quad
has the highest (391) and Talbott is second (383).
(Based on scrubbed 3m+ DEM data).
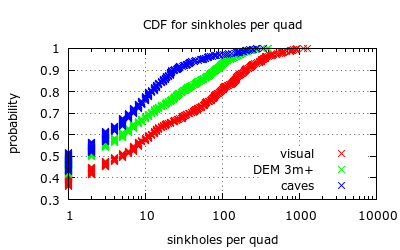
The CDF shows the density of sinkholes (caves) per quad --
36% of the quads have no visual sinkholes,
42% have no sinkholes of depth 3m+, and
43% have no caves.
To see differences in detail of visual analysis sinkholes (black pin)
versus the 3m+ DEM sinkholes (red circle) view the Anderson county
data,
topo sinkholes.
There were 625 visual sinkholes on topo map, and the digital analysis
reported 239 sinkholes of depth 3m or more (288 unscrubbed).
The spatial distribution of visual vs digital sinkholes over Anderson county is
roughly the same (hence the high spatial correlation).
Similary, the underlying sinkholes per quad are roughly the same.
For all sinkholes visible on topo, the
Talbott quadrangle has the
highest count at 1,284, but for DEM sinkholes with a depth of at least 3m,
the Livingston quad
has the highest (391) and Talbott is second (383).
(Based on scrubbed 3m+ DEM data).
The CDF shows the density of sinkholes (caves) per quad --
36% of the quads have no visual sinkholes,
42% have no sinkholes of depth 3m+, and
43% have no caves.
To see differences in detail of visual analysis sinkholes (black pin)
versus the 3m+ DEM sinkholes (red circle) view the Anderson county
data,
topo sinkholes.
There were 625 visual sinkholes on topo map, and the digital analysis
reported 239 sinkholes of depth 3m or more (288 unscrubbed).
The spatial distribution of visual vs digital sinkholes over Anderson county is
roughly the same (hence the high spatial correlation).
The scrollable table below lists caves and sinkholes per county and the sinkholes of distinction for each county -- deepest, largest area, largest volume. The last four columns are based on the digital analysis of sinkholes with a depth of at least 3m (scrubbed data).
| County | Sinkholes | Caves | sinkholes 3m+ |
depth feet |
area km2 |
volume m3 |
| Anderson | 625 | 63 | 239 | 67.6 | 0.1671 | 158,921 |
| Bedford | 1,382 | 109 | 297 | 70.2 | 3.2608 | 837,298 |
| Benton | 12 | 0 | 0 | 0 | 0 | 0 |
| Bledsoe | 150 | 24 | 55 | 53.8 | 0.1061 | 59,833 |
| Blount | 1,080 | 87 | 415 | 199.1 | 0.6977 | 1,526,579 |
| Bradley | 129 | 3 | 30 | 31.2 | 0.0612 | 15,757 |
| Campbell | 759 | 39 | 287 | 119.1 | 0.2779 | 214,349 |
| Cannon | 42 | 133 | 15 | 30.2 | 0.0251 | 9,628 |
| Carroll | 25 | 1 | 4 | 22.3 | 0.0582 | 19,016 |
| Carter | 349 | 69 | 190 | 104.3 | 1.2049 | 1,284,326 |
| Cheatham | 165 | 33 | 28 | 26.9 | 0.2078 | 60,897 |
| Chester | 3 | 0 | 2 | 23.0 | 0.0374 | 10,870 |
| Claiborne | 1,641 | 165 | 792 | 164.7 | 0.4712 | 1,001,104 |
| Clay | 286 | 48 | 102 | 50.5 | 0.5063 | 297,250 |
| Cocke | 760 | 63 | 393 | 118.1 | 0.3596 | 280,828 |
| Coffee | 447 | 67 | 71 | 52.5 | 1.1025 | 441,673 |
| Crockett | 0 | 0 | 0 | 0 | 0 | 0 |
| Cumberland | 54 | 164 | 24 | 140.1 | 13.6108 | 37,736,946 |
| Davidson | 609 | 87 | 148 | 62.0 | 0.5090 | 149,152 |
| Decatur | 47 | 19 | 23 | 48.9 | 0.1582 | 67,901 |
| DeKalb | 131 | 133 | 54 | 48.2 | 0.2021 | 70,461 |
| Dickson | 183 | 33 | 62 | 49.9 | 0.2900 | 130,843 |
| Dyer | 0 | 0 | 0 | 0 | 0 | 0 |
| Fayette | 0 | 0 | 0 | 0 | 0 | 0 |
| Fentress | 445 | 655 | 156 | 84.3 | 0.3529 | 166,336 |
| Franklin | 782 | 493 | 180 | 242.1 | 4.5087 | 4,303,666 |
| Gibson | 0 | 0 | 0 | 0 | 0 | 0 |
| Giles | 193 | 25 | 75 | 52.2 | 0.2182 | 88,226 |
| Grainger | 1,418 | 106 | 588 | 74.5 | 0.2336 | 68,002 |
| Greene | 1,618 | 107 | 664 | 86.9 | 0.7001 | 553,511 |
| Grundy | 78 | 313 | 36 | 155.8 | 0.4107 | 163,505 |
| Hamblen | 1,491 | 79 | 517 | 72.5 | 0.5234 | 193,114 |
| Hamilton | 531 | 84 | 226 | 94.8 | 0.3334 | 146,848 |
| Hancock | 817 | 81 | 431 | 108.9 | 0.2179 | 252,806 |
| Hardeman | 1 | 0 | 0 | 0 | 0 | 0 |
| Hardin | 54 | 16 | 24 | 76.1 | 0.1994 | 151,195 |
| Hawkins | 1,919 | 55 | 780 | 97.4 | 0.3878 | 375,411 |
| Haywood | 0 | 0 | 0 | 0 | 0 | 0 |
| Henderson | 29 | 0 | 1 | 15.1 | 0.0073 | 1,953 |
| Henry | 52 | 0 | 9 | 24.6 | 0.0614 | 13,007 |
| Hickman | 111 | 85 | 39 | 32.8 | 0.1961 | 48,473 |
| Houston | 72 | 14 | 23 | 26.9 | 0.0597 | 17,961 |
| Humphreys | 40 | 4 | 12 | 28.2 | 0.0502 | 18,308 |
| Jackson | 40 | 75 | 11 | 43.0 | 0.0519 | 24,332 |
| Jefferson | 2,364 | 103 | 773 | 76.8 | 0.3856 | 326,747 |
| Johnson | 20 | 25 | 12 | 47.9 | 0.0218 | 15,469 |
| Knox | 1,663 | 167 | 697 | 77.4 | 2.2135 | 1,535,832 |
| Lake | 0 | 0 | 0 | 0 | 0 | 0 |
| Lauderdale | 0 | 0 | 0 | 0 | 0 | 0 |
| Lawrence | 27 | 30 | 11 | 21.7 | 0.1862 | 47,989 |
| Lewis | 9 | 12 | 2 | 42.7 | 0.0122 | 7,840 |
| Lincoln | 92 | 18 | 29 | 66.6 | 0.1211 | 25,922 |
| Loudon | 795 | 22 | 327 | 72.5 | 1.2930 | 1,065,106 |
| Macon | 36 | 38 | 12 | 48.2 | 0.1237 | 49,246 |
| Madison | 3 | 0 | 3 | 16.4 | 0.0118 | 3,466 |
| Marion | 110 | 660 | 39 | 108.9 | 0.0249 | 16,163 |
| Marshall | 2,312 | 44 | 366 | 73.2 | 0.6609 | 121,850 |
| Maury | 1,347 | 75 | 330 | 42.3 | 0.2392 | 93,298 |
| McMinn | 427 | 12 | 168 | 49.9 | 0.2396 | 105,140 |
| McNairy | 1 | 0 | 0 | 0 | 0 | 0 |
| Meigs | 246 | 4 | 105 | 47.2 | 0.1058 | 65,192 |
| Monroe | 696 | 13 | 306 | 94.2 | 0.6779 | 360,181 |
| Montgomery | 3,025 | 81 | 900 | 84.3 | 2.6746 | 1,130,081 |
| Moore | 76 | 14 | 28 | 62.3 | 0.0930 | 62,127 |
| Morgan | 8 | 2 | 2 | 28.9 | 0.0053 | 2,046 |
| Obion | 0 | 0 | 0 | 0 | 0 | 0 |
| Overton | 2,026 | 564 | 877 | 152.2 | 2.2532 | 2,971,017 |
| Perry | 36 | 67 | 19 | 39.7 | 0.0744 | 34,181 |
| Pickett | 307 | 188 | 134 | 53.1 | 0.3581 | 131,487 |
| Polk | 149 | 6 | 36 | 77.4 | 0.2692 | 148,011 |
| Putnam | 535 | 575 | 264 | 206.0 | 4.2106 | 8,530,852 |
| Rhea | 203 | 9 | 78 | 47.2 | 0.1155 | 81,848 |
| Roane | 446 | 50 | 197 | 76.8 | 0.2637 | 186,734 |
| Robertson | 3,602 | 162 | 861 | 67.9 | 1.1984 | 527,084 |
| Rutherford | 2,988 | 130 | 572 | 76.8 | 1.4227 | 343,784 |
| Scott | 6 | 10 | 2 | 12.1 | 0.0096 | 1,693 |
| Sequatchie | 36 | 24 | 14 | 43.3 | 0.0821 | 47,539 |
| Sevier | 586 | 64 | 236 | 79.1 | 0.6025 | 486,887 |
| Shelby | 0 | 0 | 0 | 0 | 0 | 0 |
| Smith | 150 | 105 | 31 | 45.9 | 0.0786 | 39,636 |
| Stewart | 145 | 14 | 29 | 53.5 | 0.2044 | 85,549 |
| Sullivan | 1,876 | 167 | 672 | 89.2 | 0.4402 | 309,614 |
| Sumner | 371 | 42 | 53 | 47.6 | 1.2270 | 758,651 |
| Tipton | 0 | 0 | 0 | 0 | 0 | 0 |
| Trousdale | 87 | 12 | 22 | 65.6 | 0.1368 | 49,576 |
| Unicoi | 3 | 9 | 1 | 23.0 | 0.0263 | 10,712 |
| Union | 706 | 58 | 289 | 82.3 | 0.2086 | 241,526 |
| Van_Buren | 653 | 836 | 228 | 141.4 | 2.2759 | 1,334,351 |
| Warren | 1,596 | 495 | 598 | 182.1 | 4.8722 | 3,164,142 |
| Washington | 944 | 39 | 293 | 68.6 | 0.5232 | 277,137 |
| Wayne | 21 | 37 | 10 | 46.9 | 0.0734 | 20,042 |
| Weakley | 3 | 0 | 0 | 0 | 0 | 0 |
| White | 2,970 | 1,169 | 1,070 | 260.5 | 3.5128 | 3,987,376 |
| Williamson | 217 | 32 | 45 | 38.4 | 0.0602 | 17,153 |
| Wilson | 1,882 | 123 | 331 | 47.9 | 0.6967 | 207,611 |
| City | Sinkholes | per sq mile |
|---|---|---|
| Chattanooga | 154 | 1.0 |
| Clarksville | 1,181 | 12.3 |
| Jefferson City | 29 | 9.1 |
| Knoxville | 234 | 3.0 |
| McMinville | 67 | 8.4 |
| Murfreesboro | 87 | 2.9 |
| Nashville | 608 | 8.3 |
| Sparta | 79 | 13.2 |
The table at right shows the number of topo sinkholes in a few metropolitan areas. A Cookeville 2009 sinkhole floodplain report based on LiDAR found 217 sinkholes (our topo count is 52, 27 for 3m+). Chuck Sutherland's Sparta analysis using 2017 TN LiDAR elevation data. For a coarser state-wide view, see choropleth map and zoom in using topo base map (Caltopo) to see topo sinkholes.
Here are various Google maps of digital analysis for sinkholes with depth of 3m+ on 3x3 grid over 7.5' topo quad. Each cell is 2.5'x2.5' equivalent to the Shofner block.
The following tables summarize the 3m+ digital data and give the top 10 sinkholes in volume and area.
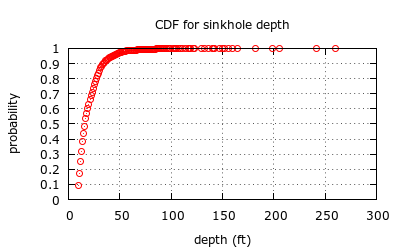
Sinkhole depth
The following table shows the distribution of depth or greater
over the collection
of sinkholes.
| Depth (ft) | Sinkholes | raw |
|---|---|---|
| 3m+ | 18,081 | 21,365 |
| 10' | 17,522 | 20,519 |
| 20' | 7,058 | 7,977 |
| 30' | 2,771 | 3,152 |
| 40' | 1,195 | 1,361 |
| 50' | 569 | 664 |
| 100' | 41 | 53 |
| 200' | 3 | 4 |
Sinkhole area
The following table lists the 10 biggest sinkholes by area (minimum depth 3m).
| Sinkhole | Area (km2) |
|---|---|
| Grassy Cove | 13.6 |
| Collier | 4.9 |
| Sinking Cove | 4.5 |
| Burtons | 4.2 |
| Old Zion | 3.5 |
| Lost Creek | 3.5 |
| Byler Bottoms | 3.3 |
| Walnut Grove | 2.9 |
| Lake Karen | 2.7 |
| Fort Campbell | 2.7 |
 Some of the sinkholes above do not show an enclosing sinkhole contour on
the topo maps, but the digital analysis provides the coordinates for
the enclosing path (for example, see Collier).
Spatial Analyst seems to underestimate size of
Northcutts Cove sinkhole???
Some of the sinkholes above do not show an enclosing sinkhole contour on
the topo maps, but the digital analysis provides the coordinates for
the enclosing path (for example, see Collier).
Spatial Analyst seems to underestimate size of
Northcutts Cove sinkhole???
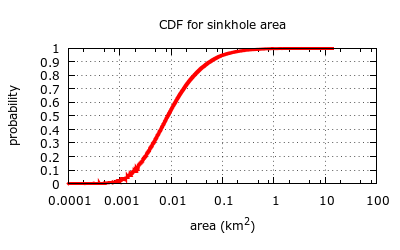
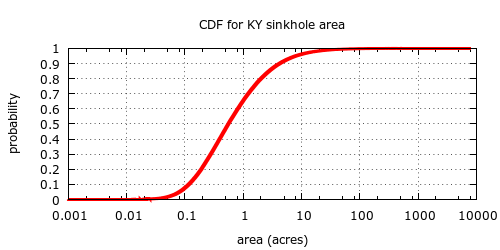
The following table shows the cumulative distribution of area over the collection of 3m+ sinkholes (raw and scrubbed data).
| Area (km2) | Sinkholes | raw |
|---|---|---|
| 0.0006 | 18,026 | 21,150 |
| 0.001 | 17,774 | 20,754 |
| 0.01 | 8,215 | 9,703 |
| 0.1 | 907 | 1,152 |
| 1 | 40 | 53 |
| 10 | 1 | 1 |
Sinkhole volume
The following table lists the 10 biggest sinkholes by volume.
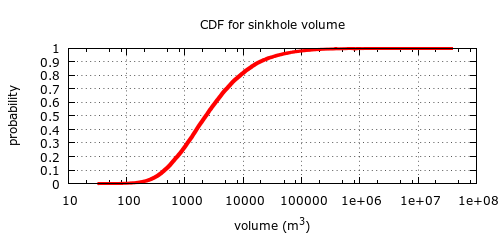
| Sinkhole | Volume (106m3) |
|---|---|
| Grassy Cove | 37.3 |
| Icy Cove | 8.5 |
| Sinking Cove | 4.3 |
| Lost Creek | 4.0 |
| The Big Sink | 4.0 |
| Big Sink | 3.2 |
| Big(gest) Sink | 3.1 |
| Cane Hollow | 3.0 |
| Lake Karen | 2.5 |
| Round Cove | 2.4 |
The following table lists the counties with the largest cumulative volume of sinkholes.
| County | 104m3 |
|---|---|
| Cumberland | 4071 |
| White | 3874 |
| Putnam | 1972 |
| Warren | 1891 |
| Franklin | 1776 |
| Overton | 1730 |
| Montgomery | 1631 |
The following table lists the USGS 7.5' topo quadrangles with the largest cumulative volume of sinkholes.
| quad | 104m3 |
|---|---|
| Grassy Cove | 4009 |
| Monterey Lake | 1173 |
| Doyle | 1125 |
| Dry Valley | 881 |
| Cardwell Mountain | 829 |
visiting sinkholes
Most of the Tennessee sinkholes are on private property, but you can visit the following:

Spatial density of Tennessee sinkholes and caves

| County | Sinkholes | Caves |
|---|---|---|
| Anderson | 625 | 63 |
| Davidson | 609 | 87 |
| Hamilton | 531 | 84 |
| Jefferson | 2,364 | 103 |
| Knox | 1,663 | 167 |
| Marshall | 2,312 | 44 |
| Montgomery | 3,025 | 81 |
| Robertson | 3,602 | 162 |
| Van Buren | 653 | 836 |
| White | 2,970 | 1,169 |
| see ESRI map | ||
The Shofner paper reports spatial correlation (0.20) between caves and sinkholes. Using our sinkholes/quad count (visual analysis) and TCS caves/quad count, we calculate a spatial correlation of 0.35 for the whole state. The spatial correlation drops to 0.30 if we exclude quads with no caves and no sinkholes. The correlation of caves to sinkholes of 3m+ depth (digital analysis) is 0.26. About 36% of the state 7.5' quads and 10 of the 95 counties have no caves and no sinkholes.
Notable public caves Lost Sea, Ruby Falls, Dunbar Cave, Bell Witch Cave, Big Bone Cave, Cumblerland Caverns, Tuckaleechee Caverns, Raccoon Mountain Caverns, and Forbidden Caverns. Blue Spring Cave is the most extensive TN cave (35 miles).
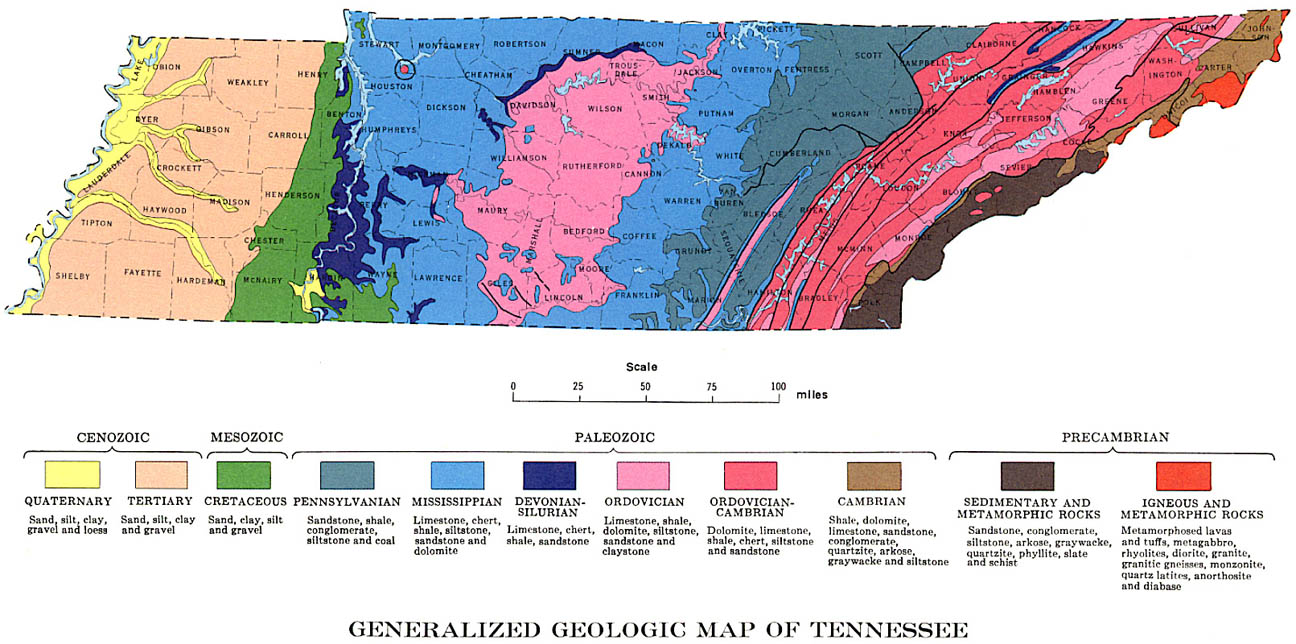
Caves and surface geology:

Additional information
| Region | Sinkholes | DEM 3m+ | Caves |
|---|---|---|---|
| Western | <1% | <1% | <1% |
| Highland Rim W | 14% | 11% | 7% |
| Central Basin | 22% | 15% | 11% |
| Highland Rim E | 15% | 16% | 33% |
| Plateau | 4% | 6% | 31% |
| Valley | 42% | 50% | 16% |
| Mountains | 1% | 1% | 2% |
Tennessee landforms
home
arches
waterfalls
rocks
peaks
balds
lakes
regions
county
GSMNP landforms (TN/NC)
BSF landforms (TN/KY)
©
Tom Dunigan
Revised
Thu, 06 Feb 2025 11:13:25 -0700
Chuck Sutherland's www.tnlandforms.com the future (2024)