It was going to be a beautiful day and I convinced Ranger Colson to let us
do an easy elevation survey at the old fire tower site on Rich Mountain.
There is an NGS data sheet for the tower site

  FB2634

that specifies elevation of 3701' at 35.628729,-83.785187.
I assume the coordinates are for tower center because there is no USGS
survey marker/disk. USGS/LiDAR elvation at that point is 3688.6'.  There is a
higher point to the east of tower center where we hammered in the rebar.
The high point is under rhodo, so I am guessing the aerial LiDAR survey
would not see that high point, but probably would see bare earth at the
former tower site.  We used an 18" diameter oak tree as a reference mark
(10' 10 3/4" to N of high point), and measured distance from rebar to
two of the tower footers (16' 9 7/8" W  and 22' 22 1/2" NW).  Photos in
album show setting.

We sited over a level from tower center and estimated high point was
about 3' higher than tower-center.

High point in USGS 10m DEM data is 3689' at 35.628657,-83.785046.
The TN LiDAR data reports the high point at 35.628689,-83.785096
with an elevation of 3695'. There is also a VABM disk
mounted in concrete about 127' downhill to the SE which shows on the topo
map with associated elevation of 3686', but there is no NGS data sheet.

Initial OPUS post-processing shows 1.6m error in ortho height
(3699.33'). Not great. There were some trees higher than the GPS, but
I thought we'd get sub-meter results.
Final OPUS results are 3699.11' at 35.628705,-83.785100
with 1.3m error.
some survey data from teqc +qc (horizon cutoff 10 degrees)
 SV+---|----------------|----------------|----------------|----------------|+ SV
 28|----_______                                                             | 28
 17|LooooooI22-II11LIooo-ILoooooL________                                   | 17
  4|LoooooooooooooooooooooooooooooooooooooooocLo-IoooooII-__________        |  4
 10|LooooooooooooooooooooooooooIo,oooooooooooo22ooo1-I-I--mI---________     | 10
 12|2I1MoLcLoooooooooooooooooooooooooo1ooooooooooooooIoo1-III2oo^_________  | 12
  2|LooIooooo,oo-IooooooooIooooooooooooooooooooooooooooooooooooooooooooIoo-I|  2
  5|-oIooooooooIoooooooooooooooooooooooooooooooooooooooooooooooooooooooooooo|  5
 25|___----I1IoooLLLo-Iooooo-mooooooooooooo,ooooo2oooooooooooo1c-I-I-mo-I___| 25
 13|__________-Looooooooooc.--II1--LIo-Io-____________                      | 13
 29|                     ________-LL-.I-Io1oI1ooooLIooooooo22ooooooooooooooo| 29
 26|                          ________--I1oL-IoIoooooooooLoI1ooooooooo,ooooo| 26
 15|                                        ________-2oI--Io-ILoooIooooooooo| 15
 21|                                                  __________-----L-IIo-I| 21
 18|                                                        _________-L1cII,| 18
  9|LooLIL                                                                  |  9
-dn|   +                                                        +           |-dn
+dn|31211111 1211    11 1 1 11 2 11 2 12    1  11  12111331211  11212111  12|+dn
+10|777777777788888888888888888888888899998888888888999999888887777778888777|+10
Pos|oooooooooooooooooooooooooooooooooooooo          oooooo                  |Pos
Clk|                                                                        |Clk
   +---|----------------|----------------|----------------|----------------|+
15:47:00.000                                                        20:02:30.000
and some SV 29 data
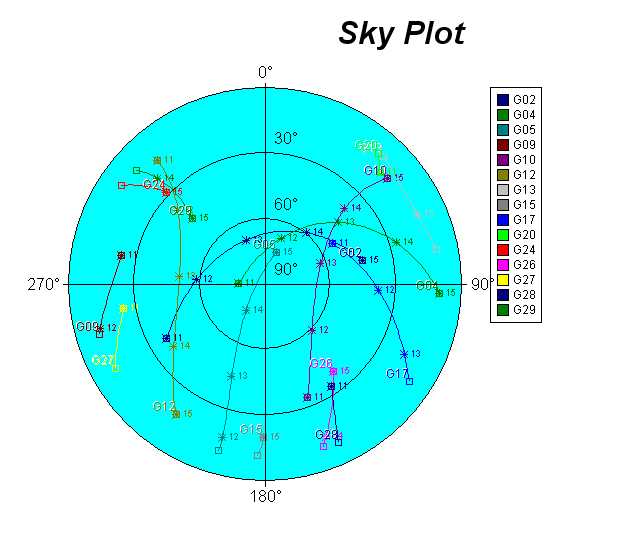
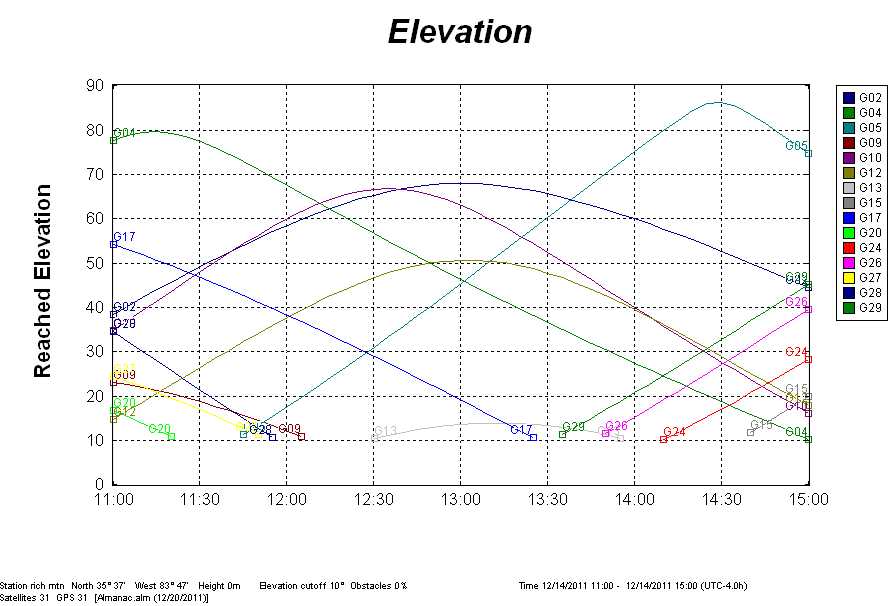
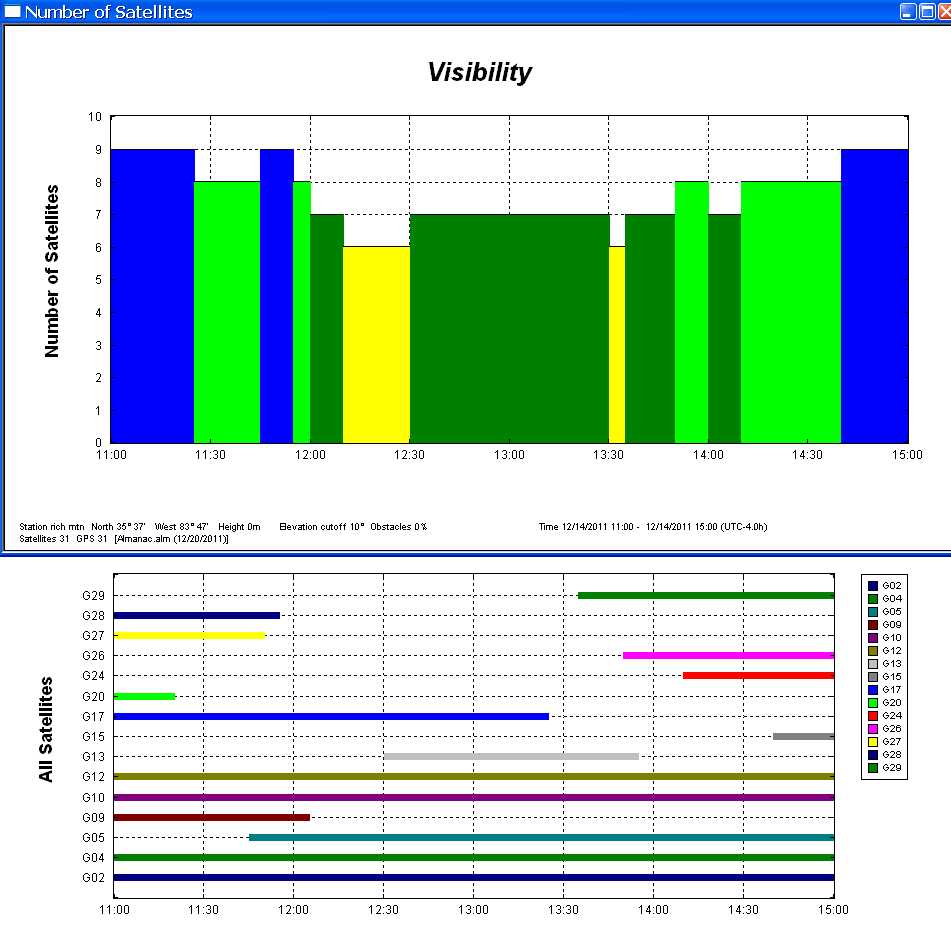
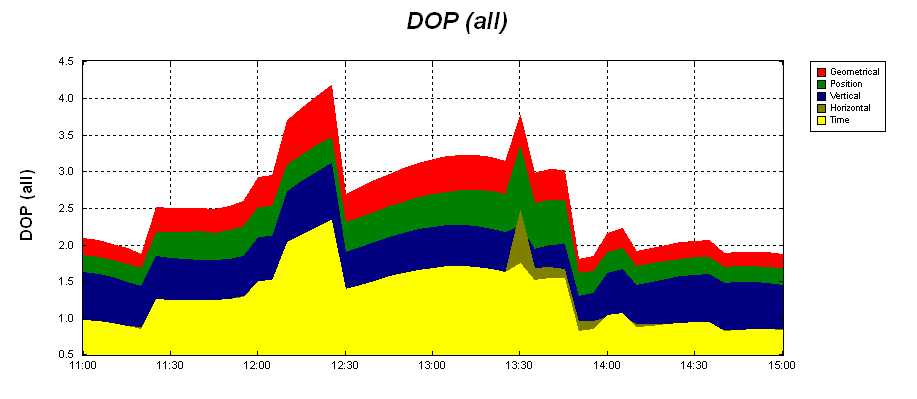
graphs from Trimble planning during time of survey