Web100 at ORNL
As part of our Net100
efforts in improving bulk transfers over
high speed, high latency networks, we are evaluating the
Web100 tools.
This work is being done by Tom Dunigan and Florence Fowler.
The Web100 project provides the software and tools necessary for end-hosts
to automatically and transparently achieve high bandwidth data rates (100
Mbps) over the high performance research networks.
Initially the software and
tools have been developed for the Linux operating system.
The Web100 distribution contains kernel patches, an API, and some
GUI tools for observing and controlling the TCP parameters of a given
flow (see GUI example).
At ORNL, we are interested in using the Web100 tools for diagnosing
network throughput problems and utilizing the auto-tuning capabilities
to optimize bulk transfers over gigabit links without using parallel streams.
We also have been using
TCP over UDP to allow us to tune TCP-like parameters and get
detailed feedback on losses/retransmissions.
This work is now part of the multi-instituion Net100
project.
To date we have Web100 installed on five ORNL x86/Linux PCs (100/1000E),
a laptop with wireless (802.11b) and 56kb slip/ppp,
a home PC over cable modem, and a UT x86/Linux PC (100E).
The Web100 project also provides access to web100-enabled Linux
boxes at NERSC, NCAR, NCSA, SLAC, CERN, and LBL.
Our current Net100 Web100-based tools include:
- java bandwidth tester/server
- ttcp100 and iperf100
- webd, provides end of flow summaries of web100 variables
- traced, provides periodic web100 variables for flows
- WAD, flow tuning daemon (event driven)
- python wad (polling) and tracer (based on LBL Net100 tools)
Java bandwidth tester
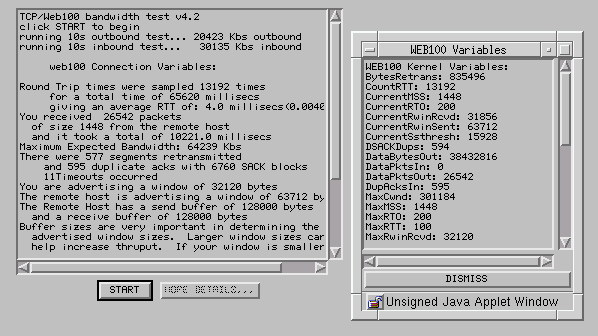
As a demonstration project,
we have developed a
Java bandwidth tester where the server reports back web100
info such as window sizes, RTT's, retransmits, SACK-enabled, etc.
as illustrated in the following figure

The applet talks with a web100-enabled server that reports back
bandwidth and information on losses and buffer sizes.
Try out our ORNL
web100 java applet.
or our UT
web100 java applet.
The server keeps a few of the Web100 stats of the transfer of the server
to the client in a log file. Here is a summary of lossy sessions from
three servers that have been active at one time or another since fall of '01.
as of 6/19/02
Server Sessions sessions with sessions with
loss timeout
-----------------------------------------
UT 2755 60% 22%
sunbird 19118 53% 24%
firebird 3882 48% 22%
See
SLAC data on Internet loss statistics.
ttcp100/iperf100
We have modified ttcp to report Web100 counters for a session.
The user provides a config file specifying which web100 variables
to report at the end of the transfer.
ttcp-t: 8388608 bytes in 47.92 real seconds = 1.34 Mbit/sec +++
ttcp-t: 8388608 bytes in 0.29 CPU seconds = 220.69 Mbit/cpu sec
ttcp-t: 1025 I/O calls, msec/call = 47.87, calls/sec = 21.39
ttcp-t: 0.0user 0.2sys 0:47real 0% 0i+0d 0maxrss 1+2pf 0+0csw
ttcp-t: buffer address 0x8054000
ttcp-t: TimestampsEnabled: 1 SACKEnabled: 1 WinScaleRcvd: 0
ttcp-t: CurrentMSS: 1424 CurrentRwinRcvd: 31856 MaxRwinSent: 31856
ttcp-t: MaxRwinRcvd: 32120 CurrentRwinRcvd: 31856 MinSsthresh: 2848
ttcp-t: MaxSsthresh: 15664 CurrentSsthresh: 2848 MaxCwnd: 2425072
ttcp-t: SACKsRcvd: 6 TimeoutsAfterFR: 0 Timeouts: 0
ttcp-t: Recoveries: 4 DupAcksIn: 25 BytesRetrans: 42720
ttcp-t: PktsRetrans: 30 DataBytesOut: 8364576 AckPktsOut: 1
ttcp-t: DataPktsOut: 5875 AckPktsIn: 2971 DataPktsIn: 0
ttcp-t: PktsIn: 2975 MinRTT: 150 MaxRTT: 220
ttcp-t: SmoothedRTT: 170
We have also added web100 summaries to iperf -- a summary for each
parallel stream.
One of the interesting problems is how long to run a ttcp or iperf
to get a good bandwidth estimate.
Often 10 seconds is chosen, but better bandwidth estimates can be had
with web100, me thinks.
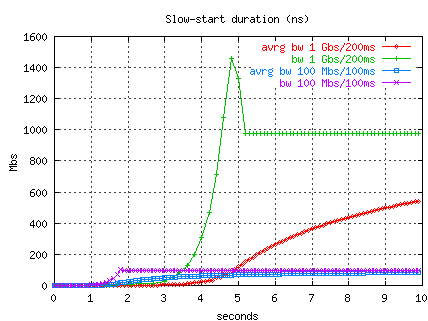
Notice in the following plot (ns simulation, no packet loss, delayed ACKs)
we plot both average and instantaneous bandwidth for a 100 Mbs path
with 100ms RTT, and a 1Gbs path with 200 ms RTT.

For the 100 Mbs path, a 10 second test will report about 90% of the available
bandwidth.
For the 1 Gbs path, a 10 second test will only report about 60% of
the real bandwidth.
Also notice that slow-start is over in about two seconds for the 100 Mbs path,
but takes nearly 5s for the 1 Gbs path.
If one waits til slow start is over, and then uses web100 variables
to get the data throughput for about a second, one can get a good bandwidth
estimate with a test under 10 seconds.
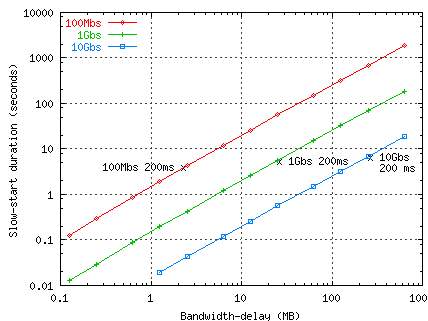
The duration of slow-start is roughly log2 of window size (in segments)
times the RTT (actually, a little less than twice this because of delayed ACKs).
For example, bandwidth delay produce for 1 Gbs/200ms RTT is about 16667
1500-byte segments.
Log2 of that is 14, so 2*14*.200 is 5.6 seconds.
For a 10GigE on the same 200ms path, slow-start lasts about 7 seconds
(see the graph below).
The time to reach 90% of the bandwidth is about 10 times the slow-start
duration minus 10 time the RTT.
Increasing the MTU/MSS can help, but doubling the MTU only removes
one RTT from the duration of slow-start.
Web100 can also tell you during the test if you're experiencing drops,
if so, you might as well terminate the throughput test.
Les Cottrell and Ajay Tirumala have some experimental results with
iperf quick mode.
(Actually using iperf -i 1 can also get instantaneous snap shots.)

webd/traced
We developed a simple web100 daemon (webd) that has a config file
of network addresses to "watch", and webd logs a selected set of Web100
variables when a "watched" stream closes.
At present, the daemon awakes each 30 seconds to check stream status.
The log is a simple flat ascii file that could be used for statistical
analysis or autotuning.
An entry from the log file looks like
cid: 557 160.91.192.165:33267<--->128.55.129.160:51163 Fri Dec 28 13:12:41 2001
DataBytesIn: 0 DataPktsIn: 0 DataBytesOut: 114100952 DataPktsOut: 78799
Timeouts: 4 Recoveries: 5 DSACKDups: 0 PktsRetrans: 96 MaxRwinSent: 5840
MaxRwinRcvd: 2097120 MinRTT: 80 MaxRTT: 6850 SmoothedRTT: 80
Rcvbuf: 4000000 Sndbuf: 4000000
So one does not need to instrument every network application, the webd
will record the web100 stats for flows to specified hosts/ports.
We also have a tracing daemon (traced) that has a config file specifying
paths and web100 variables to trace at 0.1 sec intervals.
A tracefile for each flow is produced.
We are working with PSC on a more general Web100 tracing facility.
#traced config file
#localaddr lport remoteaddr rport
0.0.0.0 0 128.55.128.74 0
0.0.0.0 0 128.55.129.160 0
***v=value, d=delta--please choose variables from the read file only!!
d PktsOut
d PktsRetrans
v CurrentCwnd
v MaxCwnd
v SampledRTT
Web100 validation testing
We did some tests to see if the web100 kernel (0.2) ran any slower for bulk
transfers.
We tested over the local net with 100 Mbs Ether and GigE with jumbo frames.
The following results show that the web100 additions have little effect
on throughput.
Recv Send Send
Socket Socket Message
Size Size Size Throughput Mbs
bytes bytes bytes web100 no web100
100T
in
262144 131072 8192 94.13 94.13
262144 131072 32768 94.13 94.13
262144 131072 65536 94.13 94.13
out
131072 262144 8192 82.89 84.46
131072 262144 32768 83.27 83.70
131072 262144 65536 82.09 83.37
gigE jumbo frames
in
262144 131072 8192 611.10 602.17
262144 131072 32768 613.91 609.16
262144 131072 65536 610.24 610.48
out
131072 262144 8192 801.22 794.70
131072 262144 32768 801.24 800.67
131072 262144 65536 800.78 800.48
We have run tests from NERSC, ANL, SDSC, ucar.edu, UT, SLAC, CERN,
wireless (802.11b), ISDN, SLIP/PPP, and home cable systems.
Wide-area networks included ESnet (OC12/OC3), UT (VBR/OC3), and Internet 2.
Local-area networks included 100T and GigE (including jumbo frame).
We have also run tests over our NISTnet testbed.
We have validated (and submitted some bug fixes) many of the Web100
variables with tcpdump/tcptrace.
Web100 as a diagnostic tool
We have used web100 to uncover a variety of network problems.
- send/recv buffer limits
- application pauses resulting in loss of ACK timing
- PIX MSS modification
- PIX sequence number randomization failing to fix SACK blocks
- numerous Linux 2.4 TCP behaviors (caching, no del ACK, sendstall)
- window scale clamping by Web100 :-(
Links
Last Modified
thd@ornl.gov
(touches: )
back to Tom Dunigan's page
or the Net100 page
