SABUL Graphs
Gnuplots of the SABUL Protocol
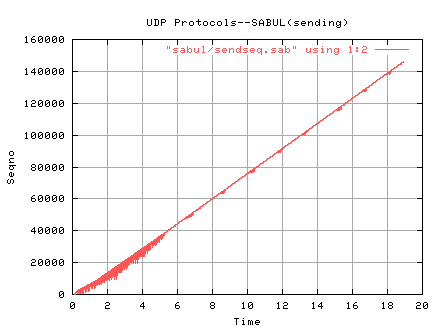
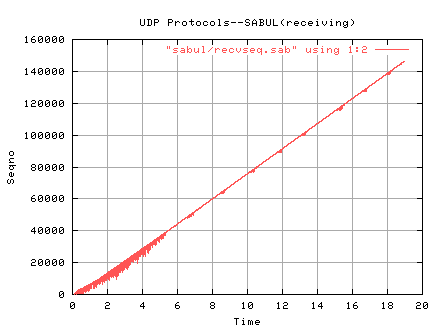

The server sent 146220 packets of new data and 19911 retransmits
for a total of 166131 packets. The client reported receiving
148317 packets of which 2097 were duplicates. When the client receives
all the packets it was expecting, it quits.
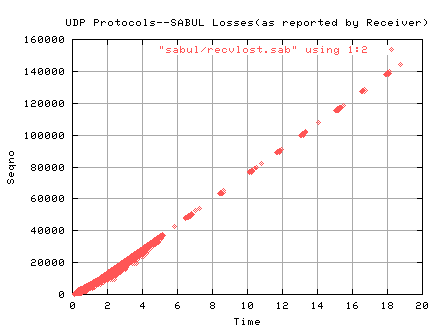 The client notifies the server of losses in 2 ways. As soon as it
receives a seqno greater than the one expected, an ERR packet
is sent. Also, periodically--every 20ms--a collective loss report
is sent. The client reported losses of 11544 packets and
re-reported 8497 of these losses again in the periodic reports.
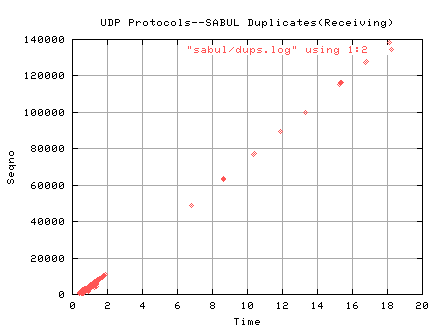
Looking at the reported duplicates, each of the 2097 duplicate packets
were received exactly twice but the server sent the 19911 retransmits
anywhere from 2 to 10 times! This may be a result of duplicate
reporting or the fact that acks are perhaps spaced too far apart??--
acks are sent every 100ms.
The client notifies the server of losses in 2 ways. As soon as it
receives a seqno greater than the one expected, an ERR packet
is sent. Also, periodically--every 20ms--a collective loss report
is sent. The client reported losses of 11544 packets and
re-reported 8497 of these losses again in the periodic reports.
Looking at the reported duplicates, each of the 2097 duplicate packets
were received exactly twice but the server sent the 19911 retransmits
anywhere from 2 to 10 times! This may be a result of duplicate
reporting or the fact that acks are perhaps spaced too far apart??--
acks are sent every 100ms.
Why are there so many losses when you would expect 16-20?
Good Question! Looking at the graphs, the retransmits/losses/duplicates seem
to be periodic probably as a result of the periodic communication
between server and client. Looking at the actual packets received,
the losses do seem to be real...more investigation is needed to see
why there are so many on a private net that would expect 16-20
drops in a file transfer of this size.


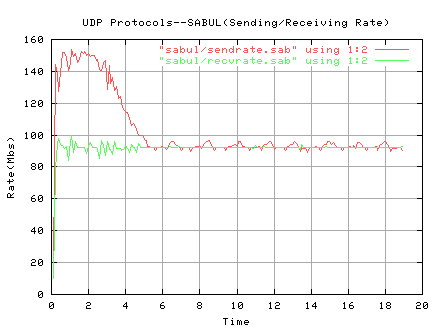
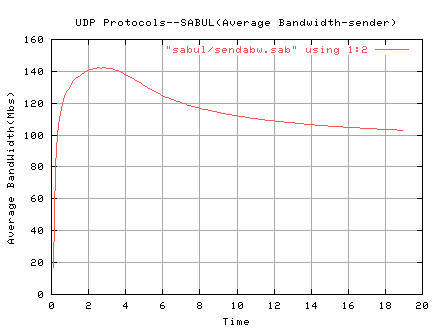
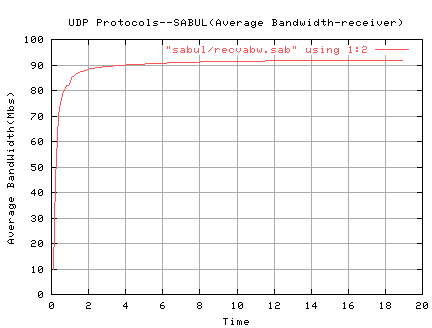
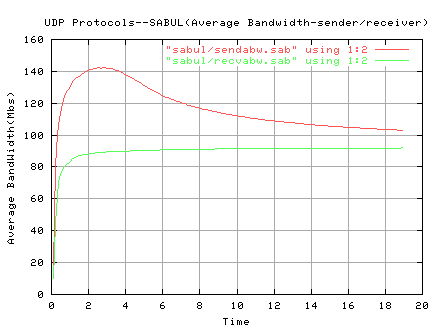
Even with the wasteful use of the bandwidth, Sabul is able to
consistently produce 80-87Mbs in thruput on a private network that
is limited to 92.8 Mbs as noted by iperf. The IPD(inter-packet delay)
starts out at 10us but, in this transfer, was slowly increased
to 117us and generally stayed between 110us and 117us. Many of the
losses/drops/retransmits occur at the beginning when the sending
rate is so high. The IPD is not adjustable by the user.