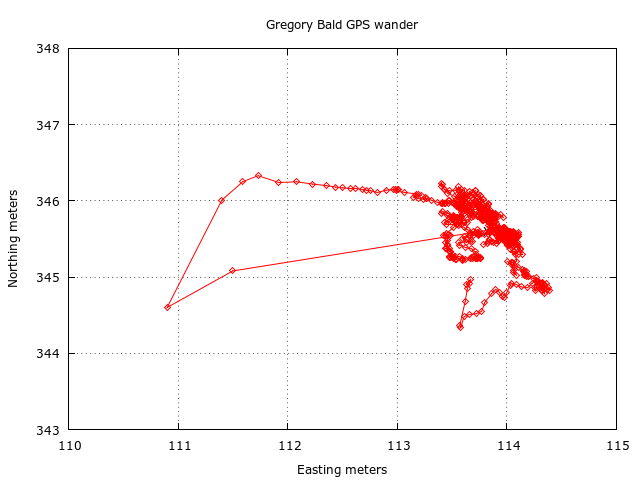
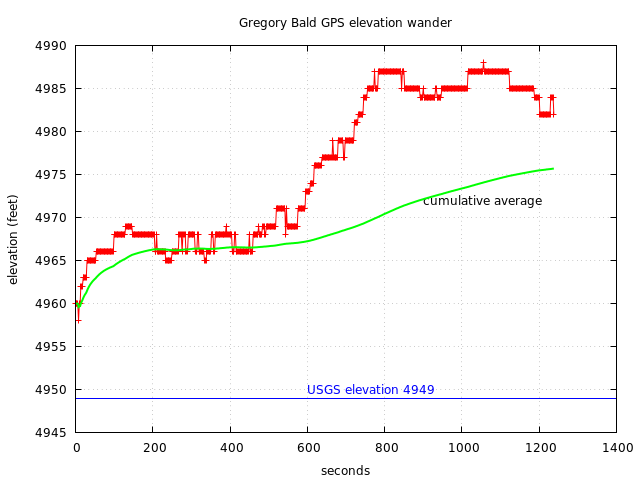
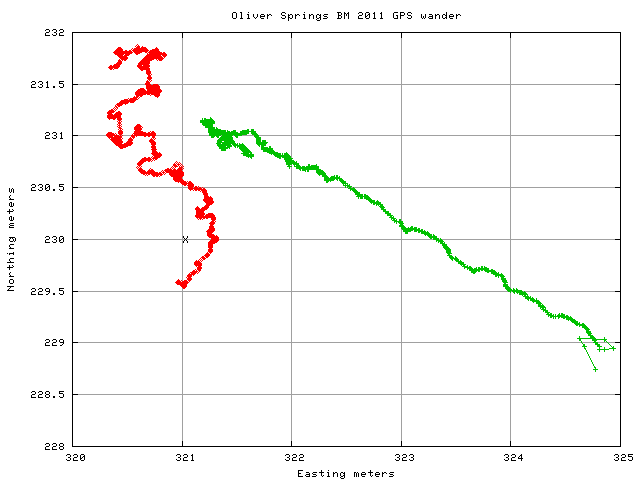
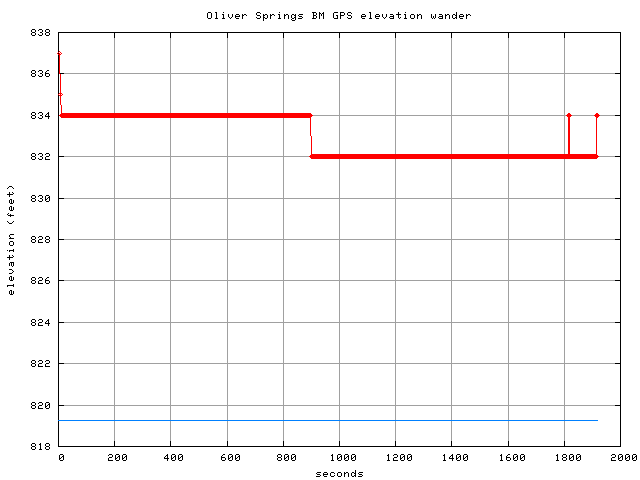
The following data gbald.gpx was collected every 2 seconds from a Garmin GPS 60cx on Gregory Bald over a 20-minute period. The GPS was sitting on the benchmark and seeing 10 to 11 satellites. The first graph illustrates the x-y wander (0.52m RMSE) and the second graph shows GPS elevation variability. From the topo, the benchmark elevation at the spot is 4949' (no NGS data sheet). WAAS was enabled on the GPS. In the graph below the NAD27 UTM averaged value is 240113.8 3934345.6, or in WGS84, 35.52060 -83.86573 just east of the location of the benchmark on the topo map. The USGS LiDAR elevation at that point is 4949.4' The NC LiDAR bare-earth data shows high point of 4948.48 east of benchmark at 35.52067,-83.86547. The TN LiDAR shows high point of 4951.1' east of benchmark at 35.520666,-83.86538.
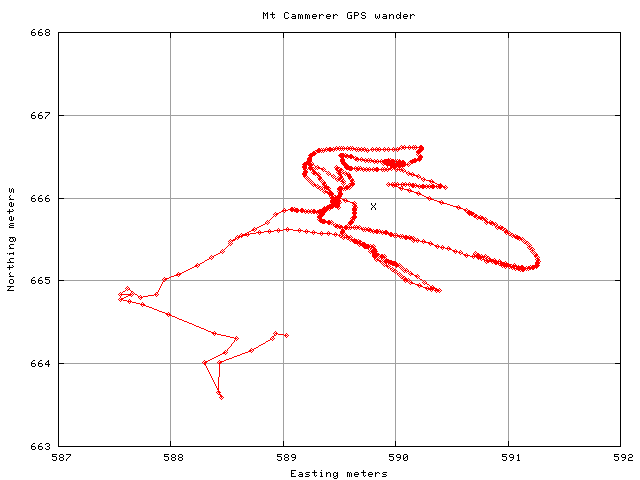
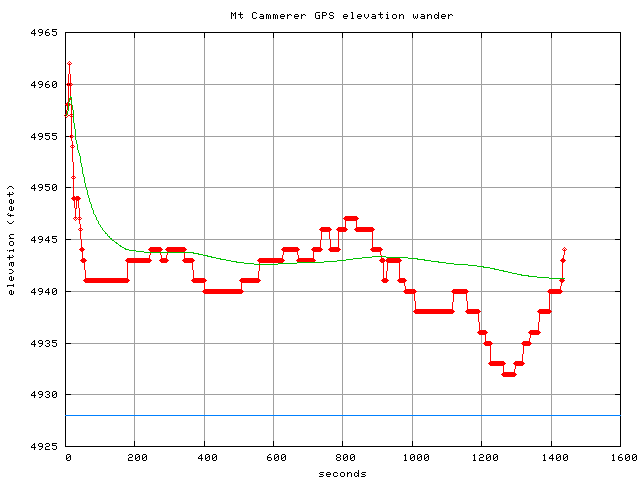
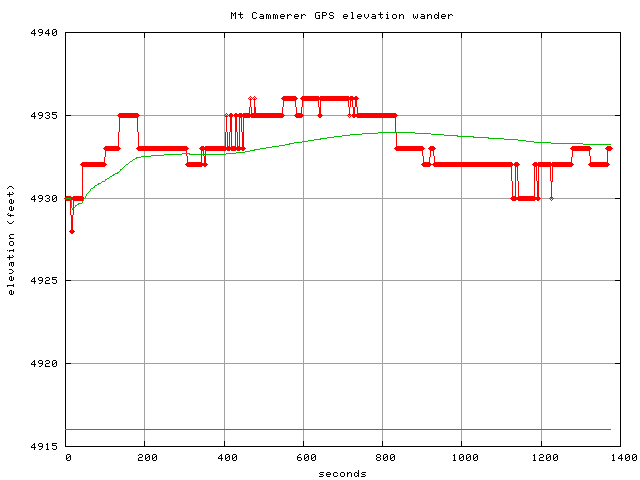
The following data mtcamm.gpx was collected every 2 seconds from a Garmin GPS 60cx on Mt Cammerer over a 20-minute period. The GPS sat atop the benchmark disk about 4' from the stairs to the tower. WAAS was not enabled. In the graph below the NAD27 UTM averaged value is 304589.8 3959665.9, or in WGS84, 35.76354 -83.16137, and the RMSE was 0.82m. The elevation from the topo map was 4928'.
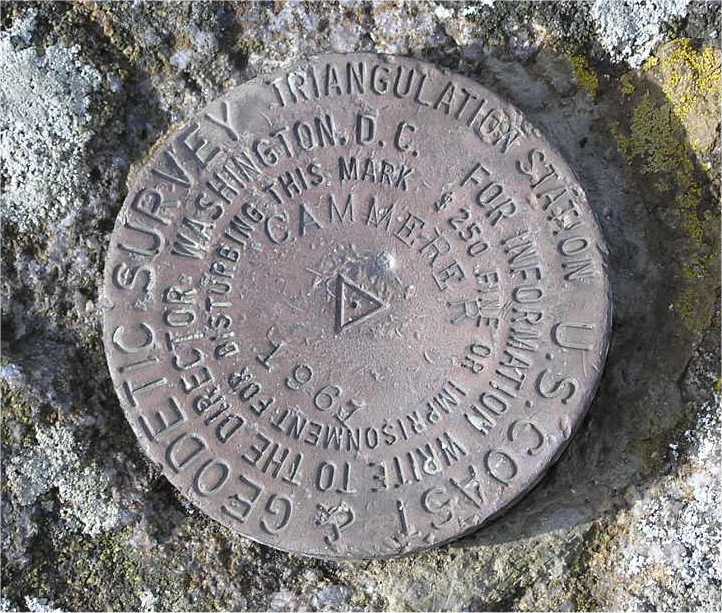
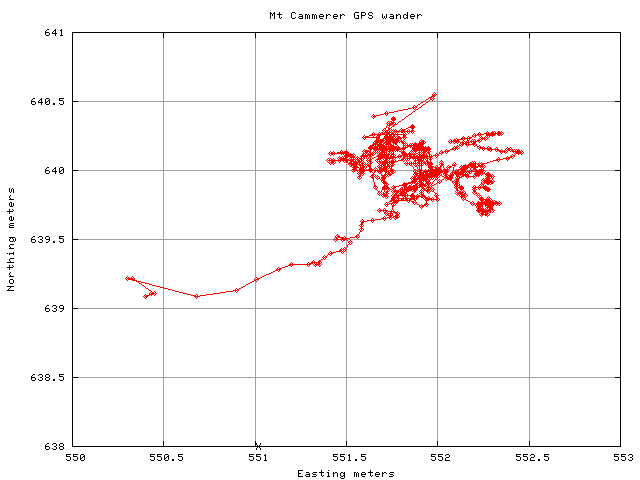
The following data was collected on the benchmark 160' west of the tower.
About 20 minutes of 2-second data was collected with WAAS enabled,
averaged location of 35.763295 -83.161788.
There is a
benchmark datasheet for this location
with an elevation of 4916 and WGS84 location 35.76328 -83.16179,
or UTM NAD27 304551 3959638 (X on the graph).
The location RMSE was 2.2 meters.
There are data sheets for nearby reference marks, the building,
FB2444
and
FB2445 at the base of the steps.
Photos are
here
The following data rocky.gpx was collected every 2 seconds over a 20 minutes period from a Garmin GPS 60cx on the rock with the benchmark disk at the AT and Jenkins Ridge trail junction at the east end of Spence Field. The GPS was sitting on the benchmark and seeing 9 satellites. Initially, the error reported by the GPS was 35' dropping to 15'. The first graph illustrates the x-y wander (1.66m RMSE) and the second graph shows elevation variability. The benchmark elevation at the spot is 4958' on topo, 4950' on marker. WAAS was enabled on the GPS. In the graph below the NAD27 UTM averaged value is 252933.9E 3938664.8N or in WGS84, 35.56278 -83.72581.
The next plot was a second visit to the Spence Field benchmark. GPS with WAAS collected 2-second data for 30 minutes. Average location was NAD27 UTM 252932.93E 3938661.77N or in WGS84 35.56275 -83.72582 (2.54m RMSE).
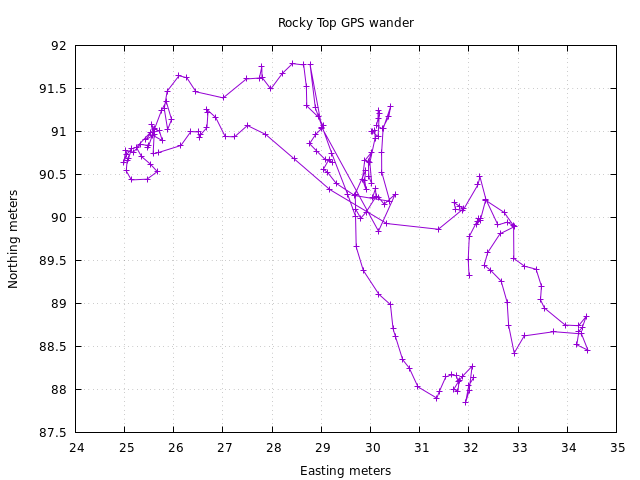
The following plot is GPS wander at Rocky Top (5441') with Garmin 62st, WAAS enabled. Two-second samples were collected for 6 minutes in 2020.
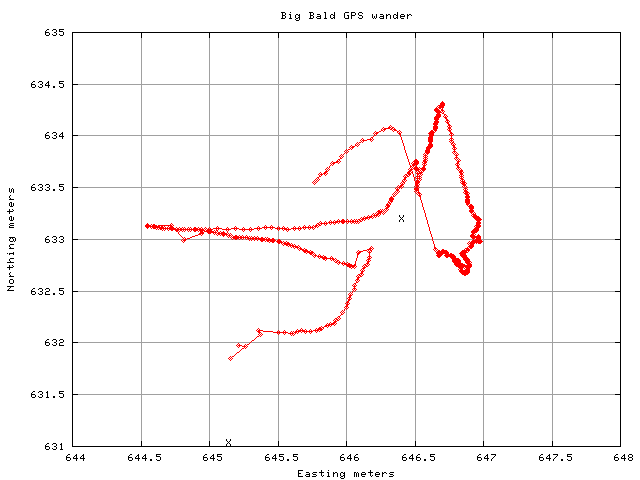
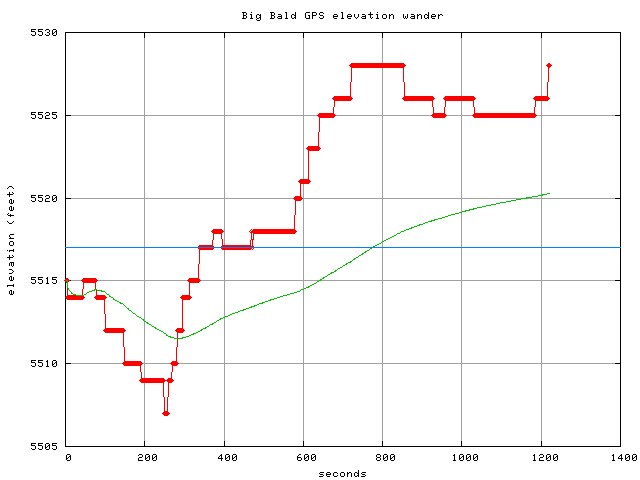
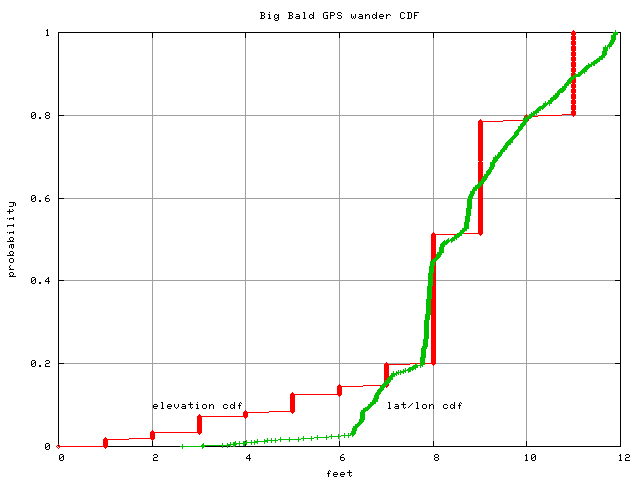
The following data bbald.gpx was collected every 2 seconds from a Garmin GPS 60cx on the rock with the benchmark disk at Big Bald over a 20-minute period. The GPS was seing 12 satellites and reporting 10' error (no WAAS). The first graph illustrates the x-y wander and the second graph shows elevation variability. The NC LiDAR bare-earth data for Big Bald has an elevation of 5516.02 at 35.98977,-82.49021 (NAD27 365652.52 3983630.04). (Note, often benchmarks are measured at a boulder where the disk can be mounted and may not be at the exact high point of the terrain.) There is a USGS datasheet for the benchmark, specifying the elevation of 5517' at 35.989778 -82.490292, or in NAD27 UTM 365645.14 3983631.04. In the graph below the NAD27 UTM averaged value is 365646.4 3983633.2 (WGS84 35.98980,-82.49028), which is a couple meters off from datasheet value. The RMSE from the average is 0.8m but from the actual value it is 2.6m.
The following is a graph of GPS elevation of a sea kayak trip on Fontana Lake from three different moving samples during the day of August 8,2008. GPS (Garmin 60cx) track data is collected every 0.01 miles. Lake level was 1687' (yellow). Red is Cable Cove to Eagle Creek, green is Eagle Creek to Hazel Creek, and blue is Hazel Creek to Cable Cove. See Garmin track or Trimble track.
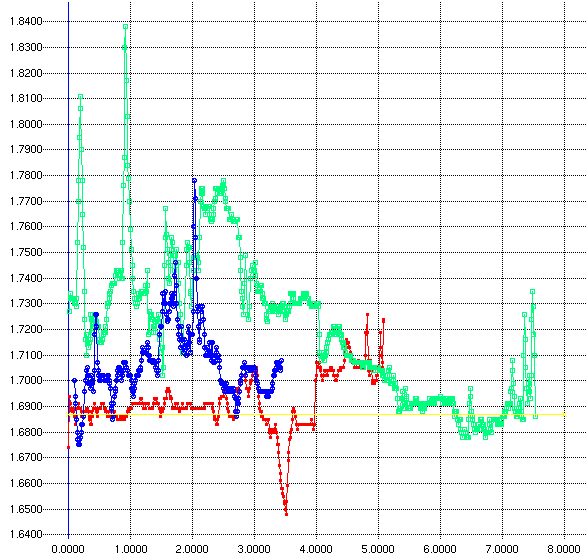 X-axis is miles, Y-axis 1000'
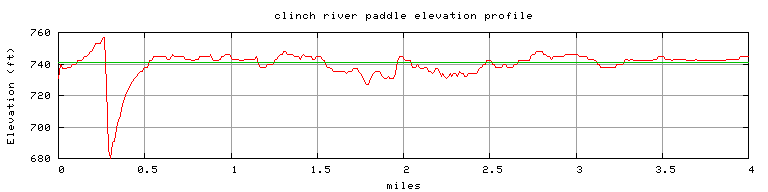
The following graph show GPS elevation variation on a paddle of Pellissippi Blueway where Watts Bar lake elevation is 741'. The early elevation dip may be due to passing under a bridge. See Garmin track.
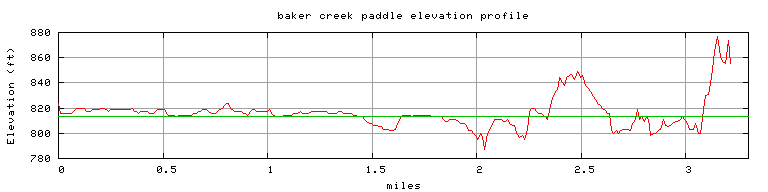
The following graph shows GPS elevation variation on a paddle of Baker Creek on Tellico Lake where lake elevation is 813'. The poor elevation data occurs in the narrow, canopied upper portions of the creek. See Garmin track.
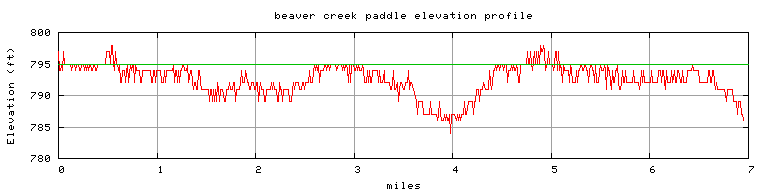
The following graph shows GPS altimeter (60csx) data on a paddle up Beaver Creek (Pellissippi Blueway). The 60csx was set to 795' without GPS corrections. There is some change in the data, though barometric data from nearby weather stations showed little variation. Also see the GPS track. In another kayak, the wrist 405cx recorded the following GPS elevation data.
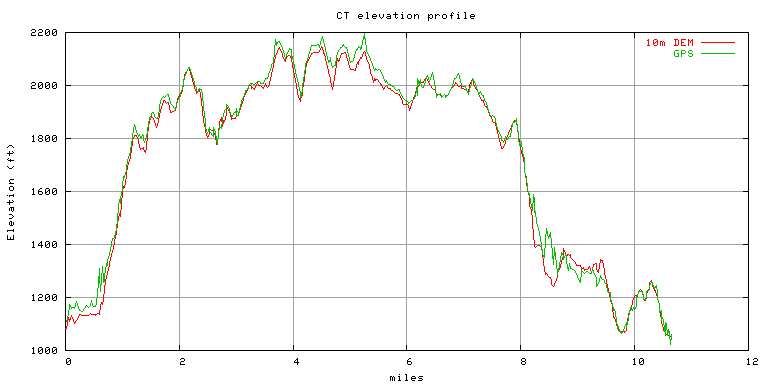
In the graph below we plot GPS elevation data versus 10m DEM data for an 11 mile hike (east to west) along the Cumberland Trail (5/5/10). GPS track data is collected every 0.01 mile. The GPS elevation matches the basic topography with a slight high bias. In the first mile the trail is in a large canyon and then on the North side of the steep ridge. At mile 8.5 the hike is in a canyon where GPS coverage is diminished. Also see same hike on trimbleoutdoors GPS track or localhikes.com description
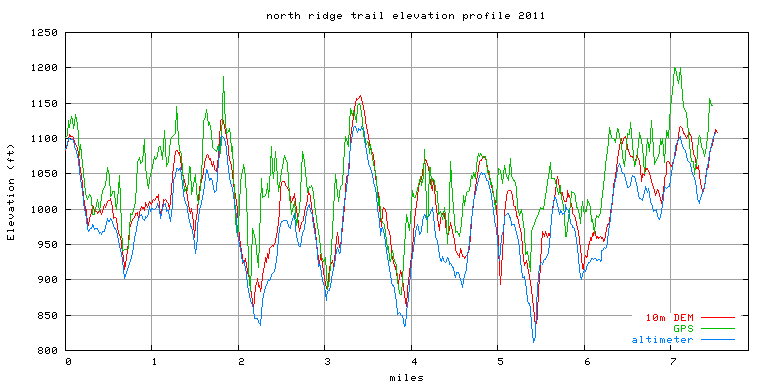
In the next graph, we plot GPS, altimeter, and 10m DEM elevation for 7.7 mile hike along the North Ridge Trail (east to west).
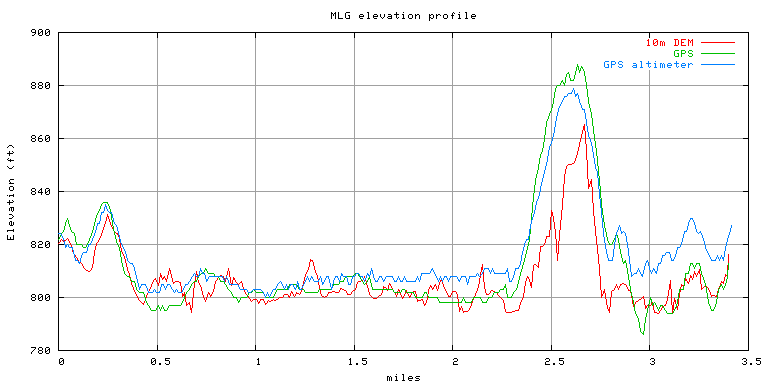
In the next graph, we plot GPS, 10m DEM elevation data, and GPS altimeter data (Garmin 60CSx) for the 3.4 mile Melton Lake Greenway.
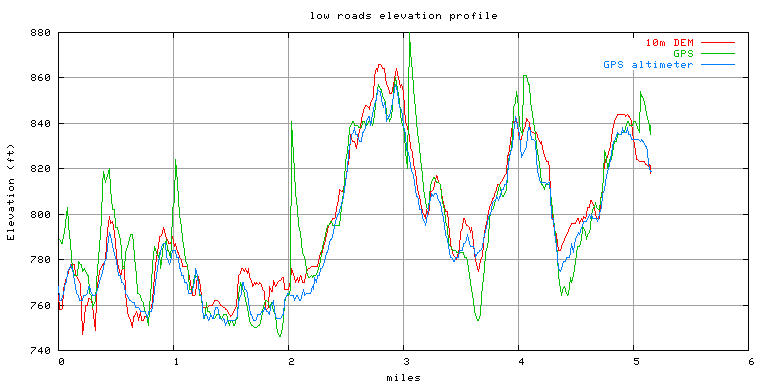
The next graph shows GPS, 10m DEM elevation data, and GPS altimeter data (Garmin 60CSx) for the 5.2 miles of the lower gravel of the North Boundary Greenway. Some of the DEM dips may be creek-crossings, and the DEM data does not account for the bridges.
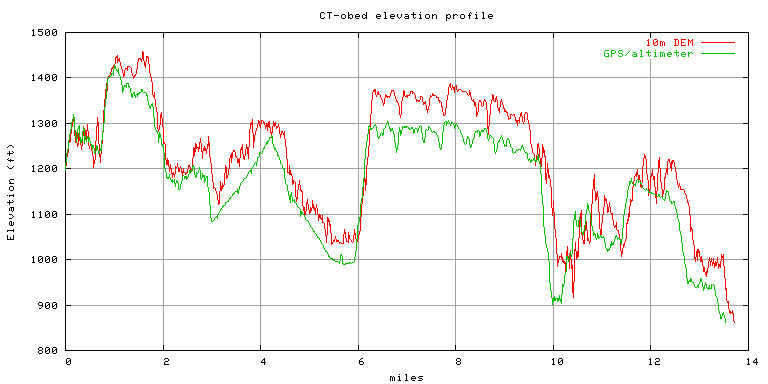
The next graph shows 10m DEM elevation data and GPS altimeter data (Garmin 60CSx) for the 14.2 miles of the Obed section of the Cumberland Trail. The altimeter data was corrected for temperature drift. The trail runs along the edge of the bluff line and the DEM data is not so accurate along vertical drops, and thus the DEM graph is very jagged.